


Public investment in infrastructure refers to government spending on economic infrastructure such as construction of roads, dams, airports, railways, and the like, including social infrastructure such as schools, hospitals and prisons and purchase of plant, machinery and equipment. Economic growth refers to increase in the amount of goods and services produced in a country i.e., GDP growth. Uganda’s GDP growth has averaged at 6 percent in the past 35 years however the recent COVID pandemic and global supply chain challenges reduced economic growth to 3% in 2020. The share of total investment in GDP peaked at 31 percent in 2013 from a low of 6 percent in 1980. It has since consistently declined to 24 percent of GDP in 2020. Of the 34 trillion Shillings that were invested in 2020, 97 percent was invested in fixed domestic assets, i.e., infrastructure. Public sector contribution to infrastructure investment in 2020 was 24 percent which accounted for 6 percent of total GDP.
Figure 1: Economic growth trend in Uganda (1985 - 2020)

Source: World Development Indicators (The World Bank, 2022)
Figure 2: GDP and Public Investment in infrastructure (1985 - 2020)
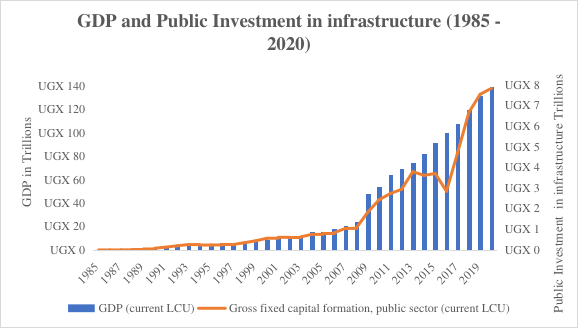
Source: World Development Indicators (The World Bank, 2022)
Infrastructure is a key priority of the Ugandan Government. During the past few years, Uganda has planned an investment push intended to accelerate and sustain the high levels of economic growth and to spur transformation into a middle-income country. Infrastructure funding currently comprises about 32.8% of the Government’s total annual expenditure. Mandated by its National Development Plan (NDP), this strategy aims at addressing the binding constraints on growth, with the most significant of these being the country’s huge infrastructure deficit.
"By improving public investment management and efficiency, Uganda can greatly increase her economic growth rate"
In the past decade, total paved roads network as a percentage of total national roads more than doubled from 8 percent in 1986 to 21.1 percent (or 4,551 km) as of May 2018 and electricity generation capacity increased from 601MW in 2010 to 1839MW in 2020. Over the past 15–20 years, the road sector has experienced significant increases in prices of road construction and maintenance. The average construction cost for upgrading roads to paved standard with bituminous surface treatment during the FY2018/19 was UGX 3.1 billion per kilometre as compared to UGX 2.36 billion per kilometre in the previous year. The average cost of rehabilitation of the paved roads was UGX 1.8 billion per kilometre as compared to UGX 1.96 billion per kilometre for the previous year. The rising expenditure on infrastructure needs to be justified by the returns on investment in terms of contribution to economic growth.
IMF examined the relationship between public investment, infrastructure quality, and economic growth on the basis of the broadest data set and found that increasing public investment efficiency could double the impact of that investment on growth. More specifically, a 1 percent of GDP increase in public investment, would increase output by just 0.3 percentage points of GDP in countries in the bottom efficiency quartile, but by 0.6 percent for countries in the top efficiency quartile. It was orated that public investment can serve as an important catalyst for economic growth, but the economic and social impact of public investment critically depends on its efficiency.
Forecasts by the World Bank in 2016 showed that the Ugandan economy would grow at an average rate of about 6 percent into the medium term yet, if the country operated at a higher level of efficiency, this growth rate could increase to almost 10 percent per annum. Over the period of 2006 - 2016, for every dollar invested in Uganda’s capital infrastructure, only seven-tenth of a dollar was generated. This was far below countries that successfully underwent structural transformation. For example, every dollar invested in the development of the interstate highway network in the United States of America between 1954 and 2001, generated six dollars’ worth of economic activity . In other words, Uganda’s public investments fall short of generating the desired economic return.
At a low level of efficiency, even very high levels of investment in the development of a country’s infrastructure stock could produce disappointing results. In other words, whatever the level of input, the degree of inefficiency prevents the investments from being converted into productive assets and hence achieving the overall objective of an accelerated rate of economic growth. Consequently, by improving public investment management and efficiency, Uganda can greatly increase her economic growth rate.
References
Adam, C., Bevan, D., & Ohlenburg, T. (2014). Public Investment and Growth in Uganda.International Growth Centre.
Ansar A., Flyvbjerg B., Budzier A., & Lunn D. (2016). Does infrastructure investment lead to economic growth or economic fragility? Evidence from China. Oxford Review of Economic Policy, Volume 32, 360–390.
IMF. (2015a). Making public investment more efficient. International Monetary Fund.
IMF. (2015b, June 18). IMF Survey : Closing Efficiency Gaps Means Big Gains for Public Investment. Retrieved from www.imf.org: https://www.imf.org/en/News/Articles/2015/09/28/04/53/sonew061815a
Miller M., Mustapha S. (2016). Public investment management: A public financial management introductory guide. London: Overseas Development Institute.
National Planning Authority. (2020). Third National Development Plan (NDPIII) 2020/21 – 2024/25. Kampala: NPA.
The World bank. (2016). Unleashing the power of public investment management. World Bank Group.
The World Bank. (2020). Digital solutions in a time of crisis. . Washington: World Bank Group.
The World Bank. (2022, June 11). The World Bank data bank. Retrieved from World Development indicators: https://databank.worldbank.org/source/world-development-indicators


View Comments